This article is to introduce a very simple and innovative way to speed up developing grid based wireframes. The display and digestion of grids is always by eye balling the columns vertically but the data input in wireframe is horizontal and you also need to wrap the data in a JSON format. To speed up, we created this Google spreadsheet where you simply add values and it generates the code for you that can be pasted in the wireframe editor.
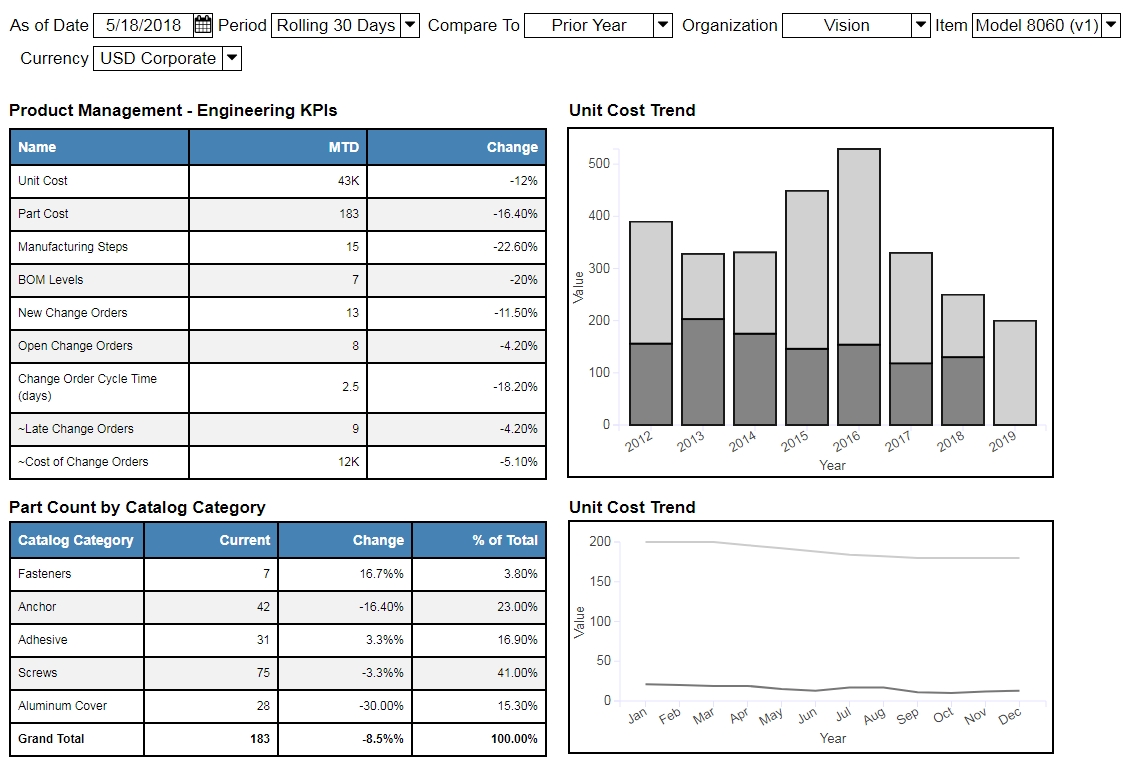
To demonstrate we create the following wireframe mockup
How to build Product Management Engineering dashboard wireframe
In this tutorial, we will build this simple mockup dashboard that covers the Product Engineering related KPIs.
Wireframes are important parts of requirements communication from business side to the technical teams.
Engineering managers and product managers can use the Product Management – Engineering dashboard and its associated reports to see if an item is complex to manufacture, or to see its change order creation and cycle time trends.
But Engineering managers are not developers so they must communicate effectively what they want to see on the dashboard.
As a manager you have your list of KPIs and some excel based mockups so let us use this as foundation to build our mockup application.
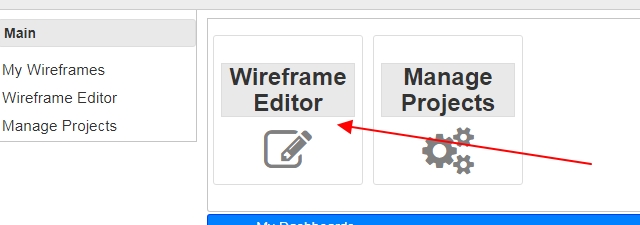
1. Login to Online Wireframes and click on the “Wireframe Editor”
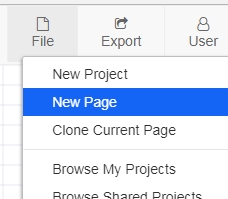
2. Create a new page
3. The wireframe will contain table grids and few charts.
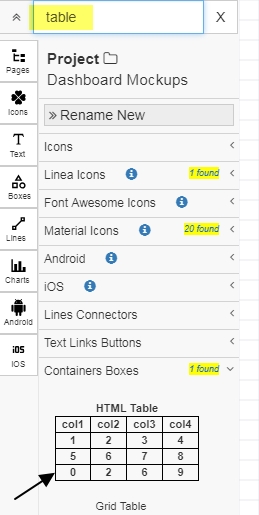
4. For adding Grid, we simply drag the Grid component from “Container Boxes”
5. Grid Data can be provided by double clicking on the grid widget and it presents a text editor to update the values.
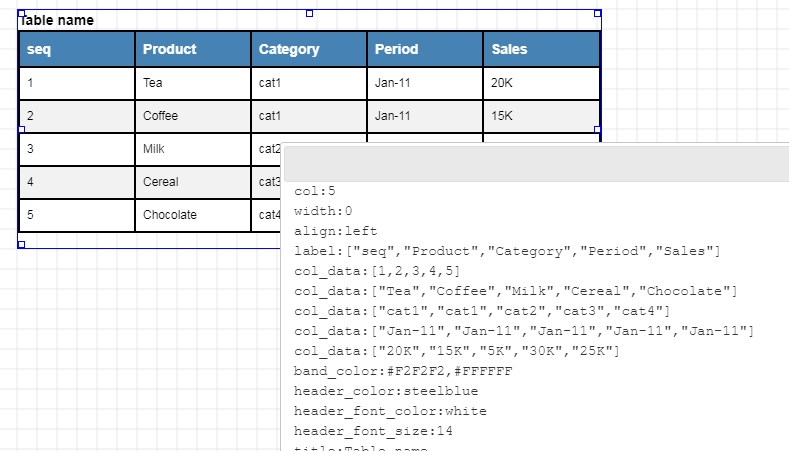
As you can see the data input is by each column. Each column is an array contained in col_data. Apart from these you need to provide the row and col values. To simplify this process we created a Grid Input Template in Google Drive.
Just copy and clone the spreadsheet for Grid table mockup
Using this template is very easy and straightforward. There are two sheets in this file 1. Raw Data and 2 Mockup Code
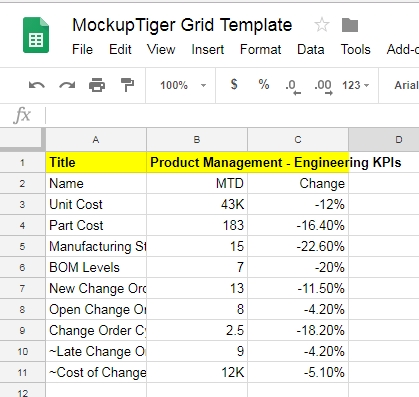
Raw Data Sheet: In this sheet you add your columns and rows as needed. At the very top you have is the Title for the table/grid.
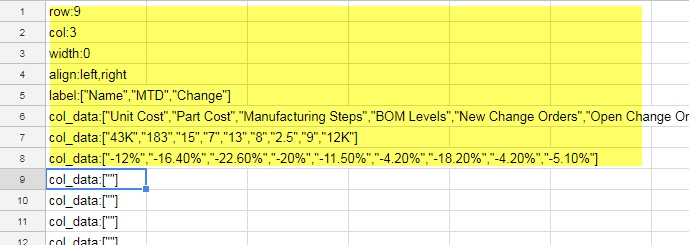
Mockup Code: In this sheet the code is automatically generated for you to simply copy and paste in mockuptiger.
Go to Mockup Code sheet, copy the first column by leaving out the rows where there is blank col_data
Having this spreadsheet speeds up building wireframes with Grids and tables.
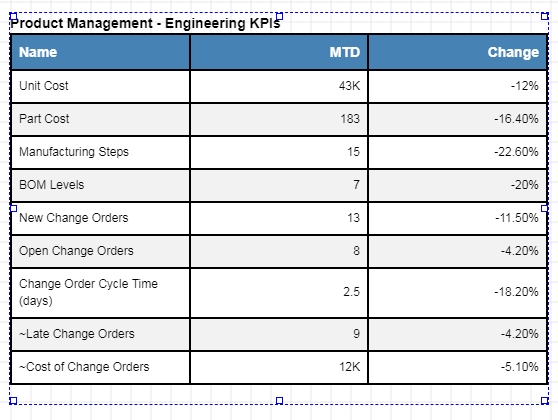
We then drag couple of chart widgets and finish the wireframe by adding drop down selectors at the top.
Final wireframe example