
Gauge or Dial Chart Wireframe Widget
One of the most wanted chart in any dashboard wireframe
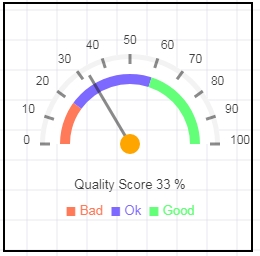
For most purposes like creating admin dashboard wireframe, you may just need to update the value and the description
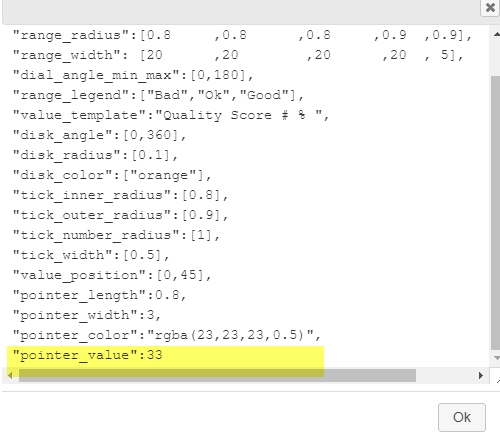
Double click the gauge and you will see all the properties. On the top you will see range related settings and the very bottom you will see the pointer value that affects the position of the pointer.
Bar Chart
Drag the charts from left panel to center work area
Double click on the chart to edit the data.
Set the number of rows and columns
How to edit the Bar chart
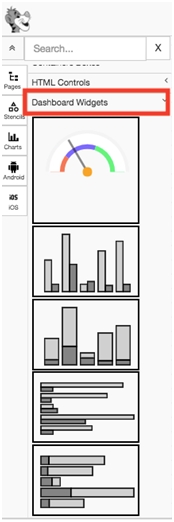
1. Simply click Charts on the Left Panel and choose any type of charts that you prefer.
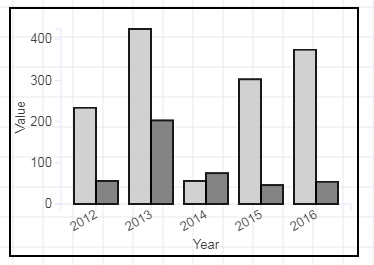
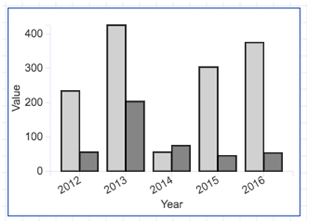
Once you decide which chart you will be using, drag and drop the chart to the wireframe editor. In this article, we use basic vertical bar chart as shown as figure below.
2. Edit the rows and columns of the bar chart
If you want to change the rows and columns data shown in the vertical bar chart, click on it twice and the new window as shown in figure below will appear.
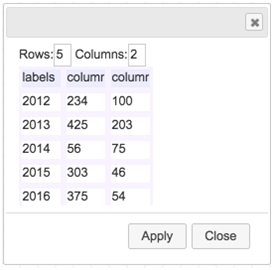
On the edit window, you can edit any data including the labels, columns data, number of columns, and rows. Click “Apply” if you want to implement the changes. Click “Close” if you want to close the edit window.
3. Duplicate the bar chart
There are two ways to duplicate the bar chart.
1. Right click on the bar chart. The new menu will appear as shown in figure below. Choose “Duplicate”.
How to edit chart properties
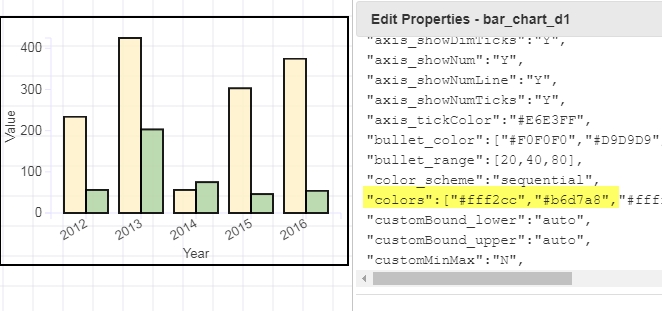
The default gray scale used for charts is sufficient for most of the dashboard wireframes but sometimes you may need to change the colors or change what appears in the X and Y Axis.
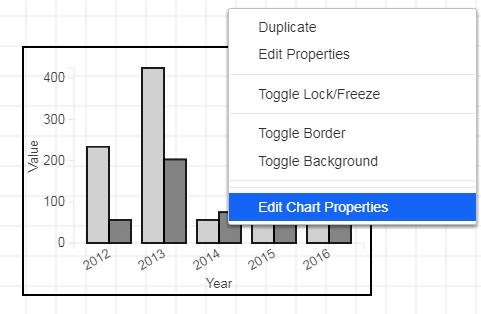
Right click on the chart and select “Edit Chart Properties”
The list of properties may appear daunting as it is based on D3js library and are real charts (not just static images). But the important properties are highlighted below
“autoMinMax”:”Y”,
“axis_dimTickCount”:10,
“axis_lineColor”:”#E6E3FF”,
“axis_numDual”:”N”,
“axis_numTickCount”:5,
“axis_showAll”:”Y”,
“axis_showDim”:”Y”,
“axis_showDimLine”:”Y”,
“axis_showDimTicks”:”Y”,
“axis_showNum”:”Y”,
“axis_showNumLine”:”Y”,
“axis_showNumTicks”:”Y”,
“axis_tickColor”:”#E6E3FF”,
“bullet_color”:[“#F0F0F0″,”#D9D9D9″,”#BDBDBD”,”#969696″],
“bullet_range”:[20,40,80],
“color_scheme”:”sequential”,
“colors”:[“#cccccc”,”#777777″,”#ffffff”,”#444444″,”#f3f3f3″,”#66666″,”#eeeeee”,”#999999″,”#bbbbbb”,”#555555″,”#aaaaaa”,”#ffffff”],
“customBound_lower”:”auto”,
“customBound_upper”:”auto”,
“customMinMax”:”N”,
“dateFormatStr”:”%Y-%m-%d”,
“fontColor_dimAxis”:”#3D3D3D”,
“fontColor_legend”:”auto”,
“fontColor_numAxis”:”#3D3D3D”,
“fontSize_dataLabel”:”auto”,
“fontSize_dimAxis”:13,
“fontSize_legend”:”auto”,
“fontSize_numAxis”:13,
“grid_numCount”:10,
“grid_numShow”:”N”,
“label_dimAxisName”:”Year”,
“label_dimAxisRotate”:”-30″,
“label_num2AxisName”:”auto”,
“label_numAxisName”:”Value”,
“label_showAxisNames”:”Y”,
“label_showDataLabel”:”N”,
“label_showXTickLabel”:”Y”,
“label_showYTickLabel”:”Y”,
“layout”:”vertical”,
“legend_display”:”N”,
“legend_x”:-150,
“legend_y”:10,
“margin_bottom”:55,
“margin_left”:50,
“margin_right”:10,
“margin_top”:20,
“markerPicker”:”same”,
“markerSize”:15,
“markerStart”:0,
“numFormatStr”:”d”,
“numPostfixStr”:””,
“numPrefixStr”:””,
“numberFormatStr”:[“,.1f”,”,.1f”],
“numberPostfixStr”:[“”,””],
“numberPrefixStr”:[“”,””],
“show_stroke”:”Y”,
“stroke_color”:”black”,
“stroke_width”:”2″,
“showAllMetrics”:”Y”,
“showMarkers”:”Y”,
“size_height”:250,
“size_width”:350,
“targetGrandMetrics”:[404],
“target_color”:[“red”,”blue”,”green”],
“target_names”:[“low”,”medium”,”high”],
“target_show”:”N”,
“target_type”:”percent”,
“target_values”:[20,40,80],
“textColor”:”#3D3D3D”,
“fontSize”:13
Example with different colors
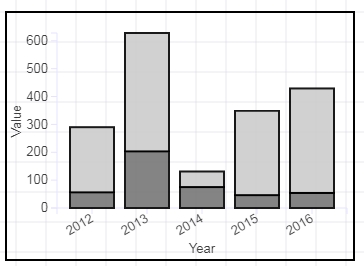
Vertical Stack Bar
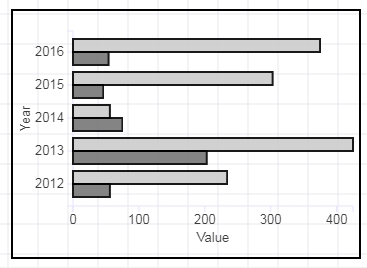
Horizontal Group bar
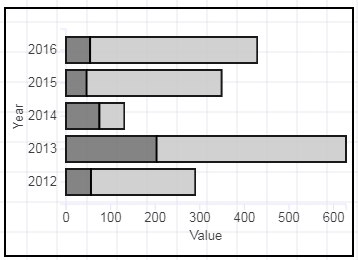
Horizontal Stack Bar
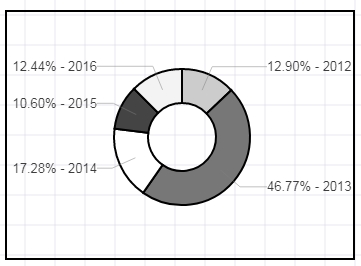
Pie or donut Chart
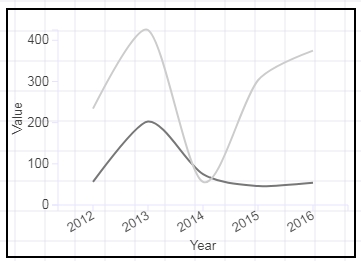
Line chart (smooth)
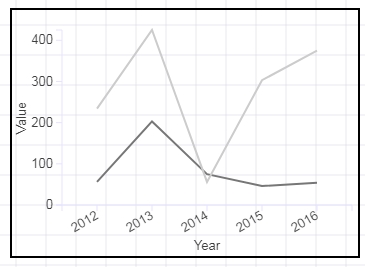
Line Chart (normal)
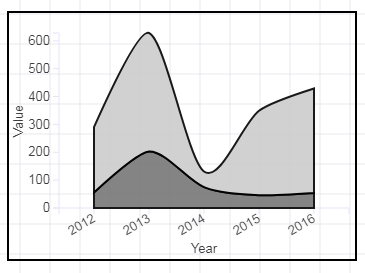
Area chart (smooth)
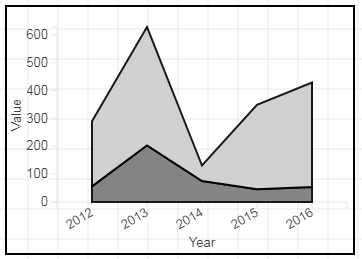
Area Chart (normal)
Tags: admin dashboard wireframe , dashboard wireframe, wireframe sketch, chart mockup, barchart wireframe, gauge mockup, line chart wireframe,dashboard wireframe sketch