
In response to Bill’s request for a KPI widget for a dashboard here is a easy way to build the desired widget.
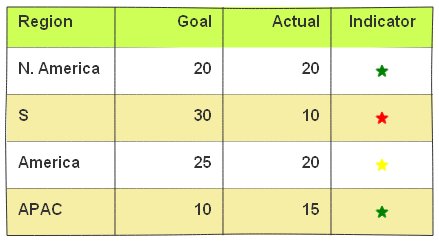
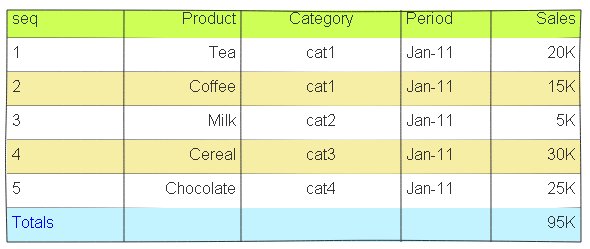
The grid_table widget is very powerful and with all the options turned on it may seem little overwelhming. Using the same grid table we produced the following KPI indicator widget
Here are the steps to reproduce this.
1. Drag the Grid table into the canvas, you will see the below
2. double click to edit the code
3. Replace the code with the following options
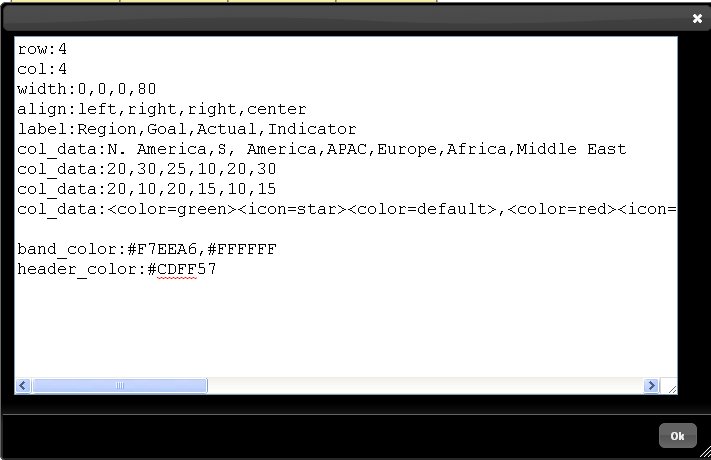
row:4
col:4
width:0,0,0,80
align:left,right,right,center
label:Region,Goal,Actual,Indicator
col_data:N. America,S, America,APAC,Europe,Africa,Middle East
col_data:20,30,25,10,20,30
col_data:20,10,20,15,10,15
col_data:<color=green><icon=star><color=default>,<color=red><icon=star><color=default>,<color=yellow><icon=star><color=default>,<color=green><icon=star><color=default>,<color=red><icon=star><color=default>,<icon=star>,<icon=star>


band_color:#F7EEA6,#FFFFFF
header_color:#CDFF57
NOTE: The star indicator is nothing but an icon name. Right click any icon from the left Icons library and wrap it with a color tag